Scyld IMF Components
Following is a list of Scyld IMF components with references to the relevant sections of this chapter where details can be found:
Nodes. Performance and status monitoring of nodes in near-realtime. Beostatus-style node statistics including per node load, per core utilization, memory, network and disk utilization. Administrators can also shut down and bring up nodes, utilize IPMI to diagnose machine and sensor state. See the Section called Nodes.
Torque. Torque Job queue monitoring and job deletion. qstat-style job statistics showing all jobs queued and running on the system. Administrators can also delete jobs. See the Section called Torque Job and Queue Status.
Ganglia. Ganglia historic node performance metrics. See the Section called Ganglia.
TaskMaster. Optional TaskMaster Web Portal access. See the Section called TaskMaster Portal.
Settings. Manage your customizations, including data fresh rates and themes (color schemata). See the Section called Settings.
Help. This is your virtual bookshelf. You find the ClusterWare documentation as well as (optionally) TaskMaster documentation, and information on support. See the Section called Help and Documentation.
Nodes
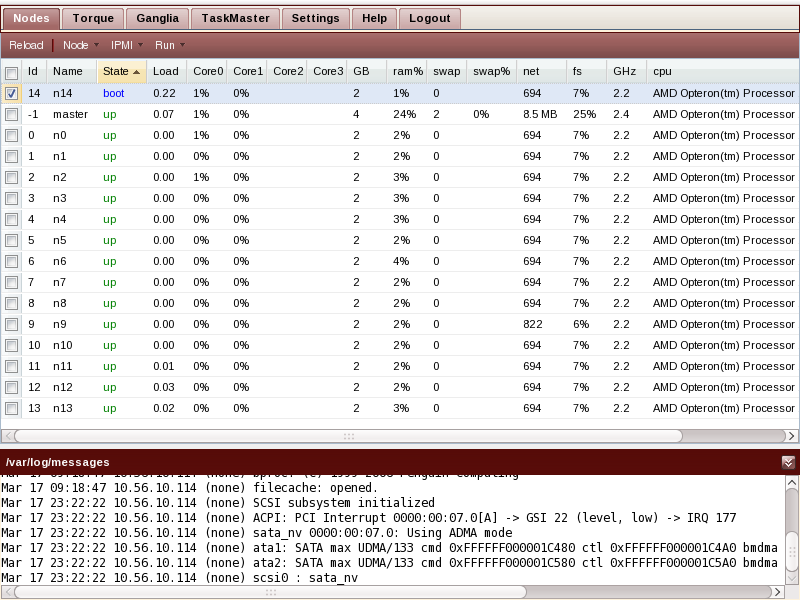
The Nodes tab shows a current view of your nodes state and performance data. It updates every 6 seconds, configurable using the Settings tab. See the Section called Settings for details. The /var/log/messages view has been uncollapsed, and boot messages of the booting node can be observed.
Customizing the data view
Note that which columns are shown, how wide they are, and what column the data is sorted by, can be customized. Resize the column by pointing between it and its right neighbor, then drag it to the size you want. Click on the triangle icon of a column header to get access to the menu that allows sorting and column selection.
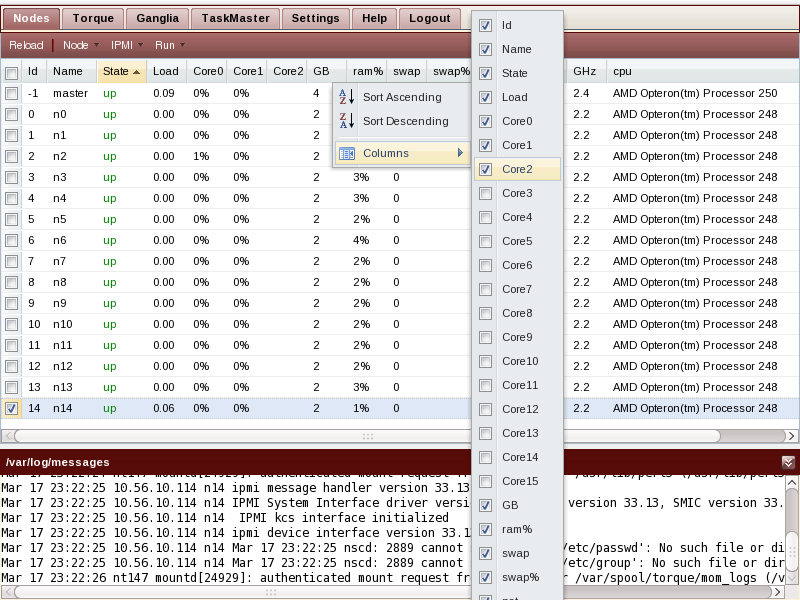
By default the utilization data for 8 cores is displayed. If you have an older cluster with less cores per node, or a newer cluster with up to 16 cores per node, you can customize the display to show only relevant columns.
An example of when Sorting by Column comes in handy would be: You are building a new cluster, added new hardware, and now while running stress-test jobs want to keep an eye on whether they are staying up. You click on the status column, select Ascending to ensure that nodes that don't have status up (i.e. boot, down, error and unavailable) show up in the list before the ones that are up.
Node Operations
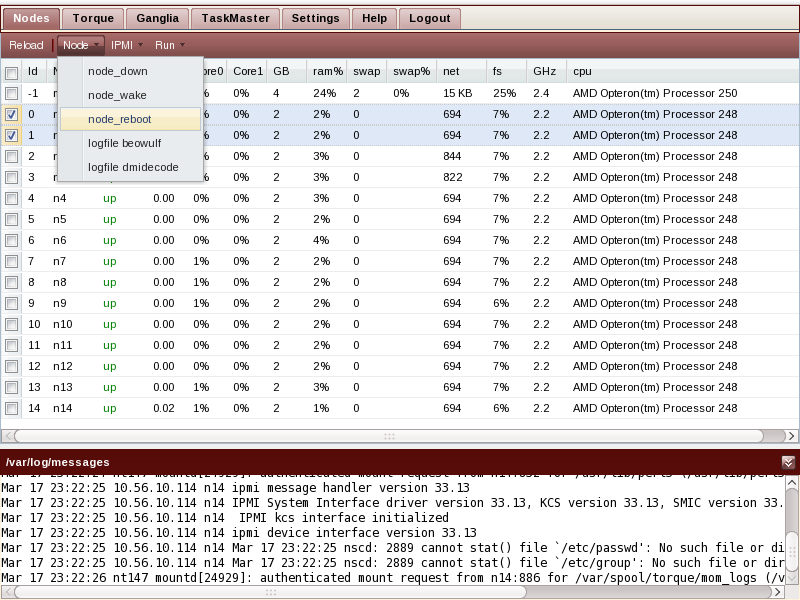
As a system administrator you can shut down, wake up, and reboot compute nodes. Note that you can select and deselect all by clicking on the checkbox in the header left of the node id column. You can also inspect the beowulf logfile of a node as well as the dmidecode output captured at boot-time.
IPMI Operations
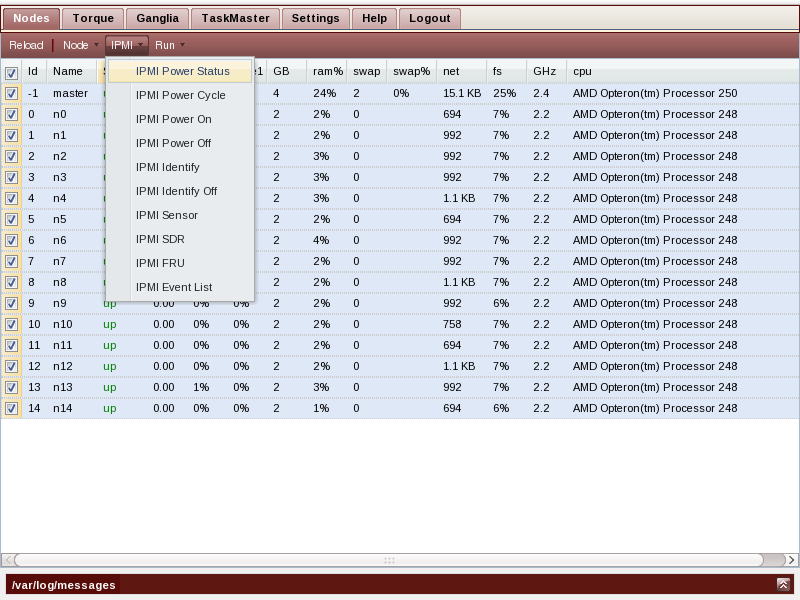
IPMI allows inspecting and manipulating compute nodes regardless of whether they are currently turned on or off, as long as the node is connected to standby power, and the network switch. As a system administrator you can inspect power status, reboot, power up and down. You can also control a chassis LED in order to signal to onsite personnel which node you want them to service. You can query the current sensor values (temperature, voltages, fan speeds), and display the FRU data (chassis, board and product model and serial numbers, asset tags).
Note that this requires setting up the compute nodes BMC to respond to remote IPMI requests.
Run commands
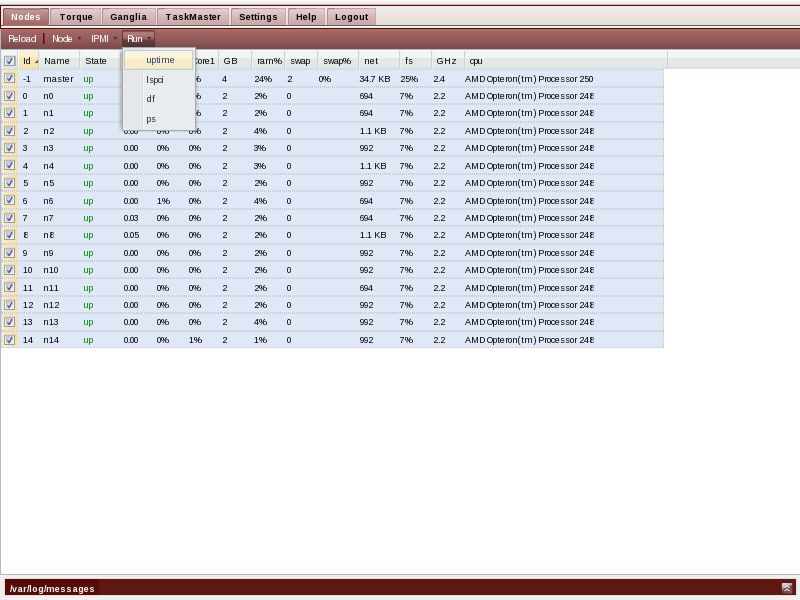
Choose from a few useful diagnostic commands to run on the compute nodes, and review the output in a tab. A tab-loading indicator will make it apparent which tab still has to load content and which ones are ready for inspection. Open as many output tabs as you want, and close them anytime by clicking on the x icon on the tab title.
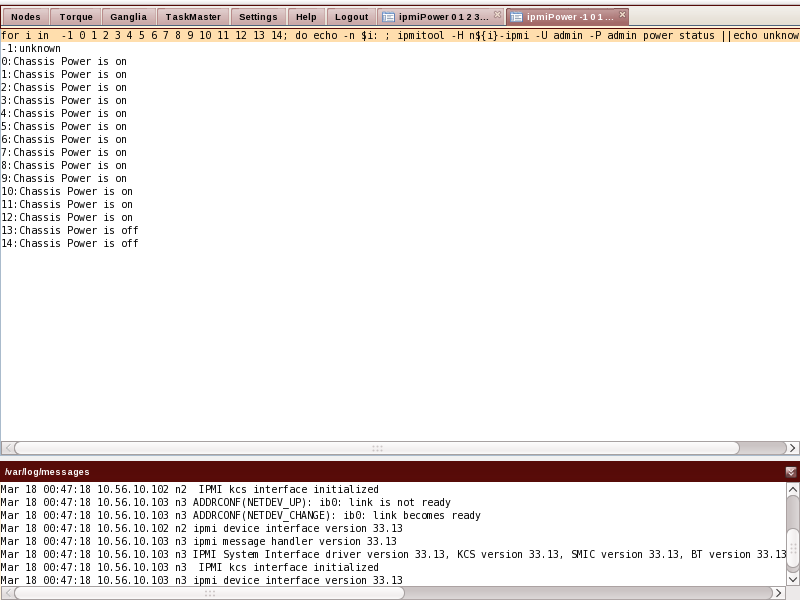
The actual command running on the master node is displayed on top of the output. This allows a user to begin learning how to use IPMI from the command line.
Torque Job and Queue Status
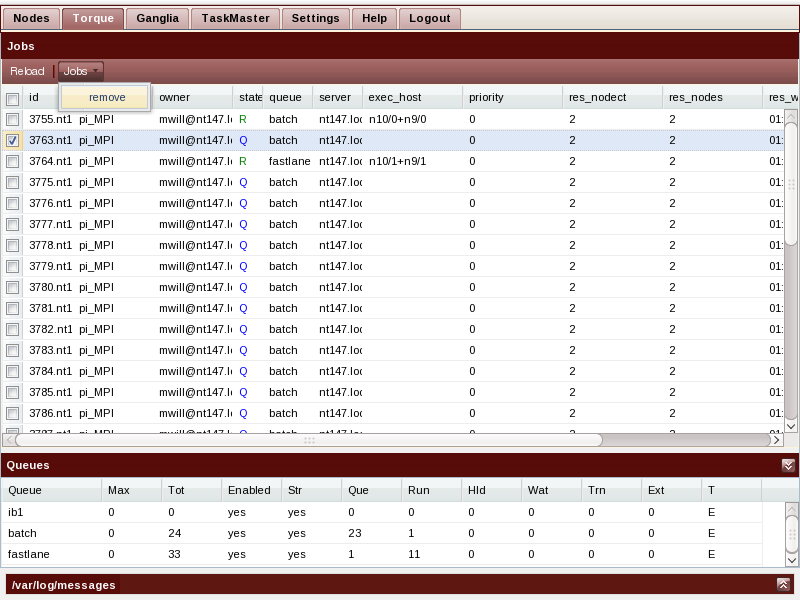
The Torque tab shows a current view of all jobs and queues. It allows the sysadmin to select and delete jobs. The screen is split horizontally between the current job view on the top, and the current queue statistics on the bottom.
Removing jobs
An administrator can select individual jobs for removal by clicking on the job entry, and select Remove from the Jobs menu. All jobs can be selected / deselected by clicking on the top checkbox next to the job id column header.
Ganglia
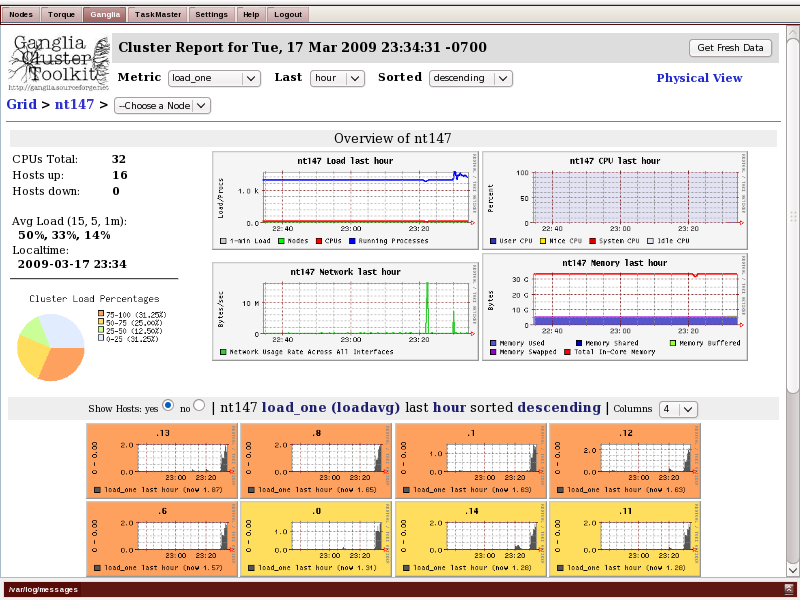
Ganglia allows inspecting graphs of historical performance data collected over time and stored in a simple database (rrd). Ganglia is an open-source project documented on http://ganglia.wiki.sourceforge.net. Quote:
Ganglia is a scalable distributed monitoring system for high-performance computing systems such as clusters and Grids. It is based on a hierarchical design targeted at federations of clusters. It leverages widely used technologies such as XML for data representation, XDR for compact, portable data transport, and RRDtool for data storage and visualization. It uses carefully engineered data structures and algorithms to achieve very low per-node overheads and high concurrency. The implementation is robust, has been ported to an extensive set of operating systems and processor architectures, and is currently in use on thousands of clusters around the world. It has been used to link clusters across university campuses and around the world and can scale to handle clusters with thousands of nodes.
TaskMaster Portal
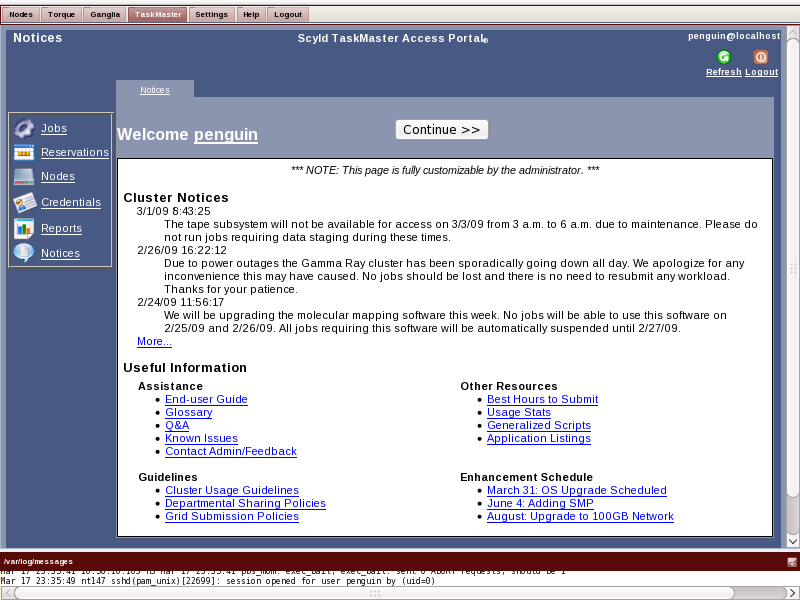
If you have the TaskMaster Web Portal installed, then you can login to it through the TaskMaster tab. Note that TaskMasters Web Portal offers a subset of the functionality of what can be accessed through the full client. The clients are available for download from the master node. See the TaskMaster documentation on the Help tab for details on the Web Portal and the full client download.
Settings
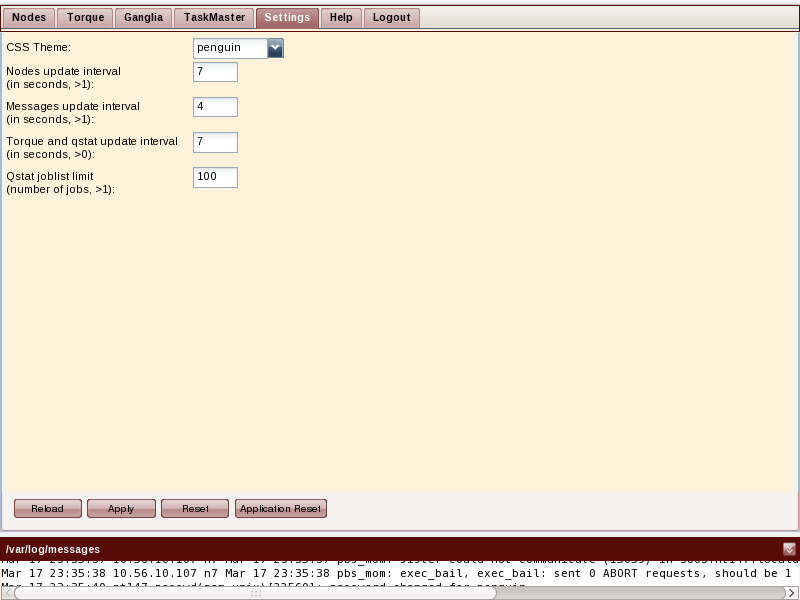
The refresh rates for the data updates, as well as the color scheme of the GUI can be configured here. All customizations, including width changes and the enabling and disabling of data columns, as well as the collapsed or uncollapsed state of the /var/log/messages view, are made persistent across login sessions by recording them in a cookie on your Web browser.
Help and Documentation
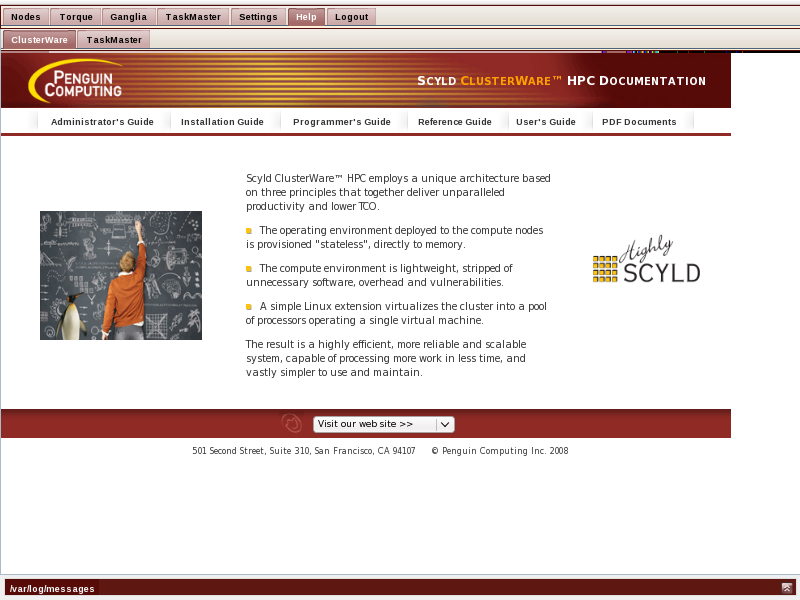
The Help tab is your bookshelf. It contains the Scyld ClusterWare and other documentation.