Cluster Verification Procedures
Once the master node and compute nodes have been configured and rebooted, you should run through the cluster verification to identify common software and hardware configuration problems. This chapter describes the Scyld ClusterWare tools for monitoring cluster status and running jobs across the cluster.
Cluster verification is generally required by reseller technical support when starting on a new issue. When you call your reseller for support, they will require that you have completed the cluster verification procedures outlined in this chapter, and that you capture information using the beosi script.
Also see the Administrator's Guide and the User's Guide for more detailed information.
Monitoring Cluster Status
You can monitor the status of the nodes in your cluster using the bpstat command or the BeoSetup tool, as described in this section.
bpstat
The bpstat command, run at a shell prompt on the master node, shows a table of status information for each node in the cluster. You do not need to be a privileged user to use this command.
Following is an example of the outputs from bpstat for a cluster with 10 compute nodes.
[root@cluster ~]# bpstat Node(s) Status Mode User Group 5-9 down ---------- root root 4 up ---x--x--x any any 0-3 up ---x--x--x root root |
Some things to keep in mind for bpstat:
Ensure that each node is listed as "up". The node count is based on the number of nodes specified by the "iprange" parameter; see the network properties in the BeoSetup Cluster Configuration screen.
Nodes that have not yet been configured are marked as "down".
Nodes currently booting are temporarily shown with a status of "boot". Wait 10-15 seconds and try again.
The "error" status indicates a node initialization problem. Check for error messages by viewing /var/log/beowulf/node.N (where N is the node number). Typical problems are failing network connections, unpartitioned hard disks, or unavailable network file systems.
BeoStatus
The BeoStatus tool is a graphical user interface (GUI) program. You can start it by clicking the BeoStatus icon on the desktop.
![]()
Alternatively, type the command beostatus in a terminal window on the master node; you do not need to be a privileged user to use this command.
You can also view the status of the cluster in text mode by typing the command beostatus -c at a terminal window on the master node.
The default BeoStatus GUI mode (shown below) is a tabular format known as the "Classic" display. Each row corresponds to a different node, with specific state and resource usage information displayed per node.
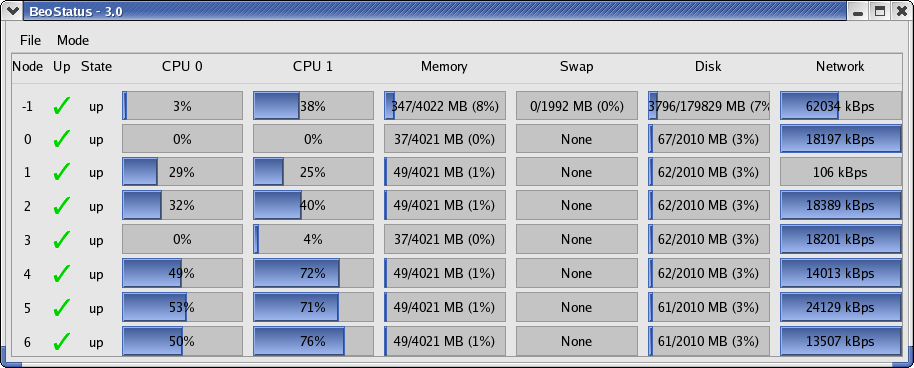
You should sanity-check the information shown in the BeoStatus window. The configured nodes that are powered up (those with a green checkmark in the "Up" column) should show expected values in the associated usage columns. When there are no active jobs on your cluster, the CPU and Network columns should be fairly close to zero. The memory usage columns (Memory, Swap, and Disk) should be showing reasonable values.
Node — The node's assigned node number, starting at zero. Node -1, if shown, is the master node. The total number of node entries shown is set by the "iprange" or "nodes" keywords in the file /etc/beowulf/config, rather than the number of detected nodes. The entry for an inactive node displays the last reported data in a grayed-out row.
Up — A graphical representation of the node's status. A green checkmark is shown if the node is up and available. Otherwise, a red "X" is shown.
State — The node's last known state. This should agree with the state reported by both the bpstat command and in the BeoSetup window.
CPU "X" — The CPU loads for the node's processors; at minimum, this indicates the CPU load for the first processor in each node. Since it is possible to mix uni-processor and multi-processor machines in a Scyld cluster, the number of CPU load columns is equal to the maximum number of processors for any node in your cluster. The label "N/A" will be shown for nodes with less than the maximum number of processors.
Memory — The node's current memory usage.
Swap — The node's current swap space (virtual memory) usage.
Disk — The node's hard disk usage. If a RAM disk is used, the maximum value shown is one-half the amount of physical memory. As the RAM disk competes with the kernel and application processes for memory, not all the RAM may be available.
Network — The node's network bandwidth usage. The total amount of bandwidth available is the sum of all network interfaces for that node.