BeoStatus
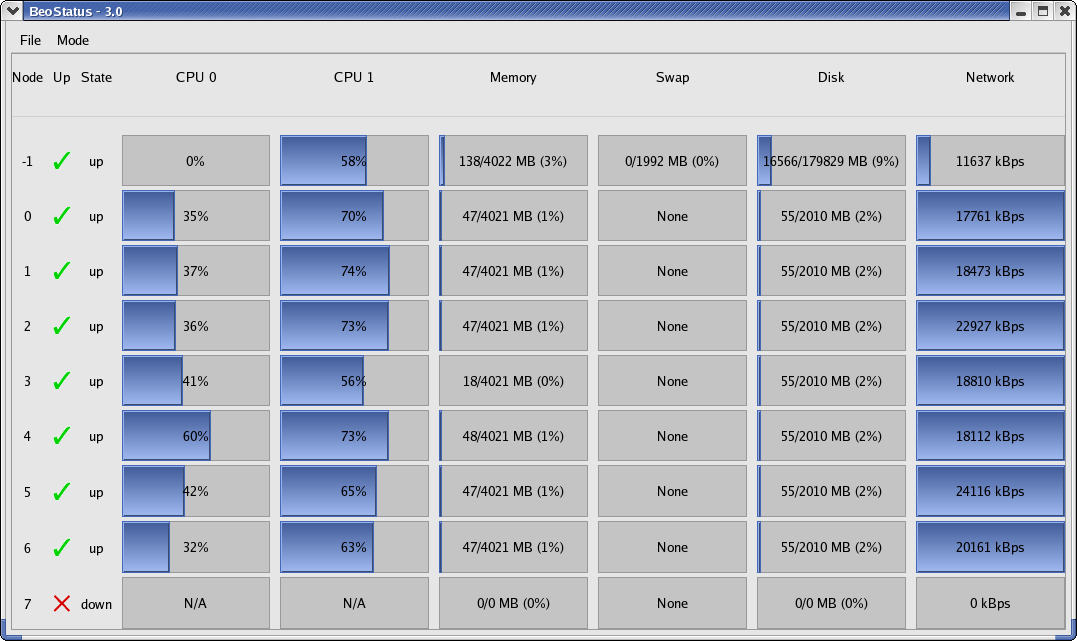
The BeoStatus GUI display is a Gnome X-window that supports four different types of display generation, all of which can be operated simultaneously. Output in bar graph mode (also known as "Classic" mode) is the default, and is provided by a Gnome/GTK+ GUI display. This display is updated once every 5 seconds by default, but the update rate may be changed using the -u option.
You can start BeoStatus by clicking the "blocks" icon on the desktop.
![]()
Alternatively, type the command beostatus in a terminal window on the master node; you do not need to be a privileged user to use this command.
BeoStatus File Menu
The File menu in the BeoStatus GUI display includes two options, Preferences and Quit, as described below.
Preferences
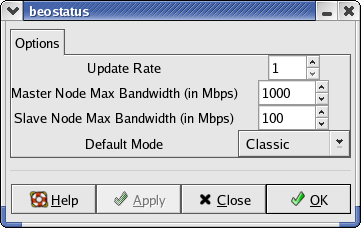
Selecting Preferences from the File menu displays the Options dialog box (shown below). You can change the values for update rate, master node maximum bandwidth, slave (compute node) maximum bandwidth, and the default display mode.
Quit
Selecting Quit from the File menu closes the BeoStatus GUI display.
BeoStatus Modes
The Mode menu in the BeoStatus GUI display allows you to choose between the various display options.
Some display options can also be accessed using command line options, including Dots mode, Curses mode, and Text mode. These display options are described in the following sections.
BeoStatus Dots Mode
Output in Dots mode (beostatus -d) provides a Gnome/GTK+ GUI display. Each node is represented by a colored dot. This output provides a small "footprint", intended for quick overviews and for situations where the screen size needed for the full display for large clusters is unavailable.

Following are the color indicators used in Dots mode:
Red — No access; node state down
Yellow — Admin access only; node state unavailable, boot, or error
Green — Ready; node state up and node load less than/equal 48%
Blue — Busy; node state up and node load greater than 48%
BeoStatus Curses Mode
Output in Curses mode (beostatus -c) prints a column header and a line for each node without a linefeed. This continuous output provides a method to monitor the system over text-only connections, such as the installed ssh server. Following is an example of the output in Curses mode:
BeoStatus - 3.0 Node State CPU 0 Memory Swap Disk Network -1 up 2.5% 91.7% 0.0% 9.2% 1 kBps 0 up 0.2% 20.5% 0.0% 25.0% 1 kBps 1 up 0.1% 20.5% 0.0% 25.0% 1 kBps 2 up 0.1% 20.5% 0.0% 25.0% 1 kBps 3 up 0.2% 20.4% 0.0% 25.0% 1 kBps 4 up 0.1% 20.3% 0.0% 25.0% 1 kBps 5 up 0.1% 20.3% 0.0% 25.0% 1 kBps 6 up 0.2% 20.6% 0.0% 25.0% 1 kBps 7 up 0.1% 20.4% 0.0% 25.0% 1 kBps |
BeoStatus Text Mode
Output in Text mode provides a method to collect continuous usage and performance statistics by directing the output to a file, with a command such as the following:
[root@cluster ~] # beostatus -t > /tmp/stat.log |
The output prints a line for each node, followed by a linefeed. The display format provides for ease of parsing with a fixed string prior to each variable data element. Following is an example of the output in Text mode.
Node: -1 CPU0: 7.2% Mem: 91.3% Swap: 0.0% Disk: 9.2% Net: 1 kBps Node: 0 CPU0: 0.2% Mem: 20.5% Swap: 0.0% Disk: 25.0% Net: 1 kBps Node: 1 CPU0: 0.1% Mem: 20.4% Swap: 0.0% Disk: 25.0% Net: 1 kBps Node: 2 CPU0: 0.3% Mem: 20.3% Swap: 0.0% Disk: 25.0% Net: 1 kBps Node: 3 CPU0: 0.2% Mem: 20.3% Swap: 0.0% Disk: 25.0% Net: 1 kBps Node: 4 CPU0: 0.3% Mem: 20.5% Swap: 0.0% Disk: 25.0% Net: 1 kBps Node: 5 CPU0: 0.3% Mem: 20.3% Swap: 0.0% Disk: 25.0% Net: 1 kBps Node: 6 CPU0: 0.2% Mem: 20.6% Swap: 0.0% Disk: 25.0% Net: 1 kBps Node: 7 CPU0: 0.3% Mem: 20.4% Swap: 0.0% Disk: 25.0% Net: 1 kBps |