Monitoring Node Status
You can monitor the status of nodes in your cluster with the BeoStatus GUI tool or with either of two command line tools, bpstat and beostat. These tools are described in the sections that follow. Also see the Reference Guide for information on the various options and flags supported for these tools.
The BeoStatus GUI Tool
The BeoStatus graphical user interface (GUI) tool is the best way to check the status of the cluster, including which nodes are available or "up". There are two ways to open the BeoStatus GUI as a Gnome X window, as follows.
Click the BeoStatus icon in the tool tray or in the applications pulldown.
![]()
Alternatively, type the command beostatus in a terminal window on the master node; you do not need to be a privileged user to use this command.
The default BeoStatus GUI mode is a tabular format known as the "Classic" display (shown in the following figure). You can select different display options from the Mode menu.
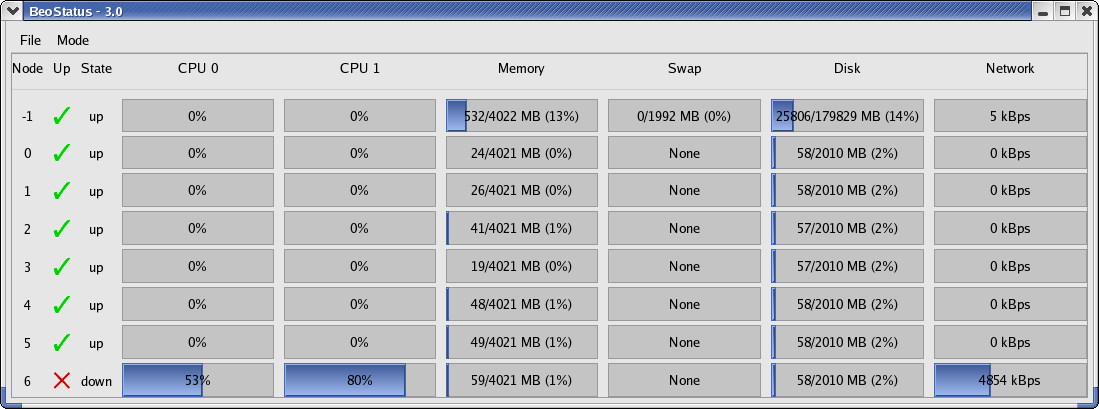
BeoStatus Node Information
Each row in the BeoStatus display reports information for a single node, including the following:
Node — The node's assigned node number, starting at zero. Node -1, if shown, is the master node. The total number of node entries shown is set by the "iprange" or "nodes" keywords in the file /etc/beowulf/config, rather than the number of detected nodes. The entry for an inactive node displays the last reported data in a grayed-out row.
Up — A graphical representation of the node's status. A green checkmark is shown if the node is up and available. Otherwise, a red "X" is shown.
State — The node's last known state. This should agree with the state reported by both the bpstat command and in the BeoSetup window.
CPU "X" — The CPU loads for the node's processors; at minimum, this indicates the CPU load for the first processor in each node. Since it is possible to mix uni-processor and multi-processor machines in a Scyld cluster, the number of CPU load columns is equal to the maximum number of processors for any node in your cluster. The label "N/A" will be shown for nodes with less than the maximum number of processors.
Memory — The node's current memory usage.
Swap — The node's current swap space (virtual memory) usage.
Disk — The node's hard disk usage. If a RAM disk is used, the maximum value shown is one-half the amount of physical memory. As the RAM disk competes with the kernel and application processes for memory, not all the RAM may be available.
Network — The node's network bandwidth usage. The total amount of bandwidth available is the sum of all network interfaces for that node.
BeoStatus Update Intervals
Once running, BeoStatus is non-interactive; the user simply monitors the reported information. The display is updated at 4-second intervals by default. You can modify this default using the command beostatus -u secs (where secs is the number of seconds) in a terminal window or an ssh session to the master node with X-forwarding enabled.
 | Each update places load on the master and compute nodes, as well as the interconnection network. Too-frequent updates can degrade the overall system performance. |
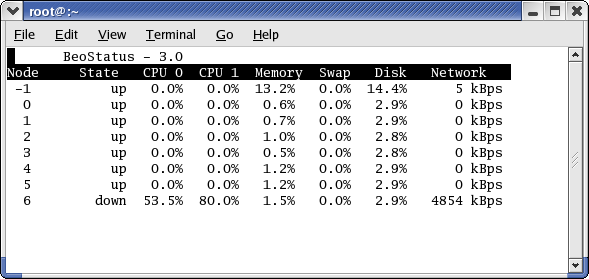
BeoStatus in Text Mode
In environments where use of the Gnome X window system is undesirable or impractical, such as when accessing the master node through a slow remote network connection, you can view the status of the cluster as curses text output (shown in the following figure). Do do this, enter the command beostatus -c in a terminal window on the master node or an ssh session to the master node.
BeoStatus in text mode reports the same node information as reported by the "Classic" display, except for the graphical indicator of node "up" (green checkmark) or node "down" (red X). The data in the text display is updated at 4-second intervals by default.
The bpstat Command Line Tool
You can also check node status with the bpstat command. When run at a shell prompt on the master node without options, bpstat prints out a listing of all nodes in the cluster and their current status. You do not need to be a privileged user to use this command.
Following is an example of the outputs from bpstat for a cluster with 10 compute nodes.
[user@cluster user] $ bpstat
  Node(s)     Status       Mode       User       Group
    5-9         down         ---------- root       root
    4           up           ---x--x--x any        any
0-3 up ---x--x--x root root |
bpstat will show one of the following indicators in the "Status" column:
A node marked "up" is available to run jobs. This status is the equivalent of the green checkmark in the BeoStatus GUI.
Nodes that have not yet been configured are marked as "down". This status is the equivalent of the red X in the BeoStatus GUI.
Nodes currently booting are temporarily shown with a status of "boot". Wait 10-15 seconds and try again.
The "error" status indicates a node initialization problem. Check with your Cluster Administrator.
For additional information on bpstat, see the section on monitoring and controlling processes later in this chapter. Also see the Reference Guide for details on using bpstat and its command line options.
The beostat Command Line Tool
You can use the beostat command to display raw status data for cluster nodes. When run at a shell prompt on the master node without options, beostat prints out a listing of stats for all nodes in the cluster, including the master node. You do not need to be a privileged user to use this command.
The following example shows the beostat output for the master node and one compute node:
[user@cluster user] $ beostat
model           : 5
model name      : AMD Opteron(tm) Processor 248
stepping        : 10
cpu MHz         : 2211.352
cache size      : 1024 KB
fdiv_bug        : no
hlt_bug         : no
sep_bug         : no
f00f_bug        : no
coma_bug        : no
fpu             : yes
fpu_exception   : yes
cpuid level     : 1
wp              : yes
bogomips        : 4422.05

 *** /proc/meminfo *** Sun Sep 17 10:46:33 2006
        total:    used:    free:  shared: buffers:  cached:
Mem:  4217454592 318734336 3898720256        0 60628992        0
Swap: 2089209856        0 2089209856
MemTotal:   4118608 kB
MemFree:    3807344 kB
MemShared:        0 kB
Buffers:      59208 kB
Cached:           0 kB
SwapTotal:  2040244 kB
SwapFree:   2040244 kB

 *** /proc/loadavg *** Sun Sep 17 10:46:33 2006
3.00 2.28 1.09 178/178 0

 *** /proc/net/dev *** Sun Sep 17 10:46:33 2006
Inter-|   Receive                                                |  Transmit
 face |bytes    packets errs drop fifo frame compressed multicast|bytes    packets errs drop fifo colls carrier compressed
  eth0:85209660   615362        0        0        0     0          0         0 703311290  559376        0        0        0     0       0          0
  eth1:4576500575 13507271        0        0        0     0          0         0 9430333982 13220730        0        0        0     0       0          0
  sit0:       0        0        0        0        0     0          0         0       0       0        0        0        0     0       0          0

 *** /proc/stat ***
cpu0 15040 0 466102 25629625            Sun Sep 17 10:46:33 2006
cpu1 17404 0 1328475 24751544           Sun Sep 17 10:46:33 2006

 *** statfs ("/") *** Sun Sep 17 10:46:33 2006
path:           /
f_type:         0xef53
f_bsize:        4096
f_blocks:       48500104
f_bfree:        41439879
f_bavail:       38976212
f_files:        24641536
f_ffree:        24191647
f_fsid:         000000 000000
f_namelen:      255


============== Node: .0 (index 0) ==================

 *** /proc/cpuinfo *** Sun Sep 17 10:46:34 2006
num processors  : 2
vendor_id       : AuthenticAMD
cpu family      : 15
model           : 5
model name      : AMD Opteron(tm) Processor 248
stepping        : 10
cpu MHz         : 2211.386
cache size      : 1024 KB
fdiv_bug        : no
hlt_bug         : no
sep_bug         : no
f00f_bug        : no
coma_bug        : no
fpu             : yes
fpu_exception   : yes
cpuid level     : 1
wp              : yes
bogomips        : 4422.04

 *** /proc/meminfo *** Sun Sep 17 10:46:34 2006
        total:    used:    free:  shared: buffers:  cached:
Mem:  4216762368 99139584 4117622784        0        0        0
Swap:        0        0        0
MemTotal:   4117932 kB
MemFree:    4021116 kB
MemShared:        0 kB
Buffers:          0 kB
Cached:           0 kB
SwapTotal:        0 kB
SwapFree:         0 kB

 *** /proc/loadavg *** Sun Sep 17 10:46:34 2006
0.99 0.75 0.54 36/36 0

 *** /proc/net/dev *** Sun Sep 17 10:46:34 2006
Inter-|   Receive                                                |  Transmit
 face |bytes    packets errs drop fifo frame compressed multicast|bytes    packets errs drop fifo colls carrier compressed
  eth0:312353878   430256        0        0        0     0          0         0 246128779  541105        0        0        0     0       0          0
  eth1:       0        0        0        0        0     0          0         0       0       0        0        0        0     0       0          0

 *** /proc/stat ***
cpu0 29984 0 1629 15340009              Sun Sep 17 10:46:34 2006
cpu1 189495 0 11131 15170565            Sun Sep 17 10:46:34 2006

 *** statfs ("/") *** Sun Sep 17 10:46:34 2006
path:           /
f_type:         0x1021994
f_bsize:        4096
f_blocks:       514741
f_bfree:        492803
f_bavail:       492803
f_files:        514741
f_ffree:        514588
f_fsid:         000000 000000
f_namelen:      255
|
The Reference Guide provides details for using beostat and its command line options.